

Embedded Creative Partner for Mobility & Transport
Helping mobility companies launch products, win tenders, exhibit internationally, and communicate complex technology through design.
Trusted by mobility teams for 7+ years
From startup through acquisition, I worked as an extension of the WideSense and Fleetcast team across product, marketing and business development.
50+ deliverables
Pitch decks
Websites
LinkedIn campaigns
Trade show booths
Product UX
Interactive demos
Sales collateral
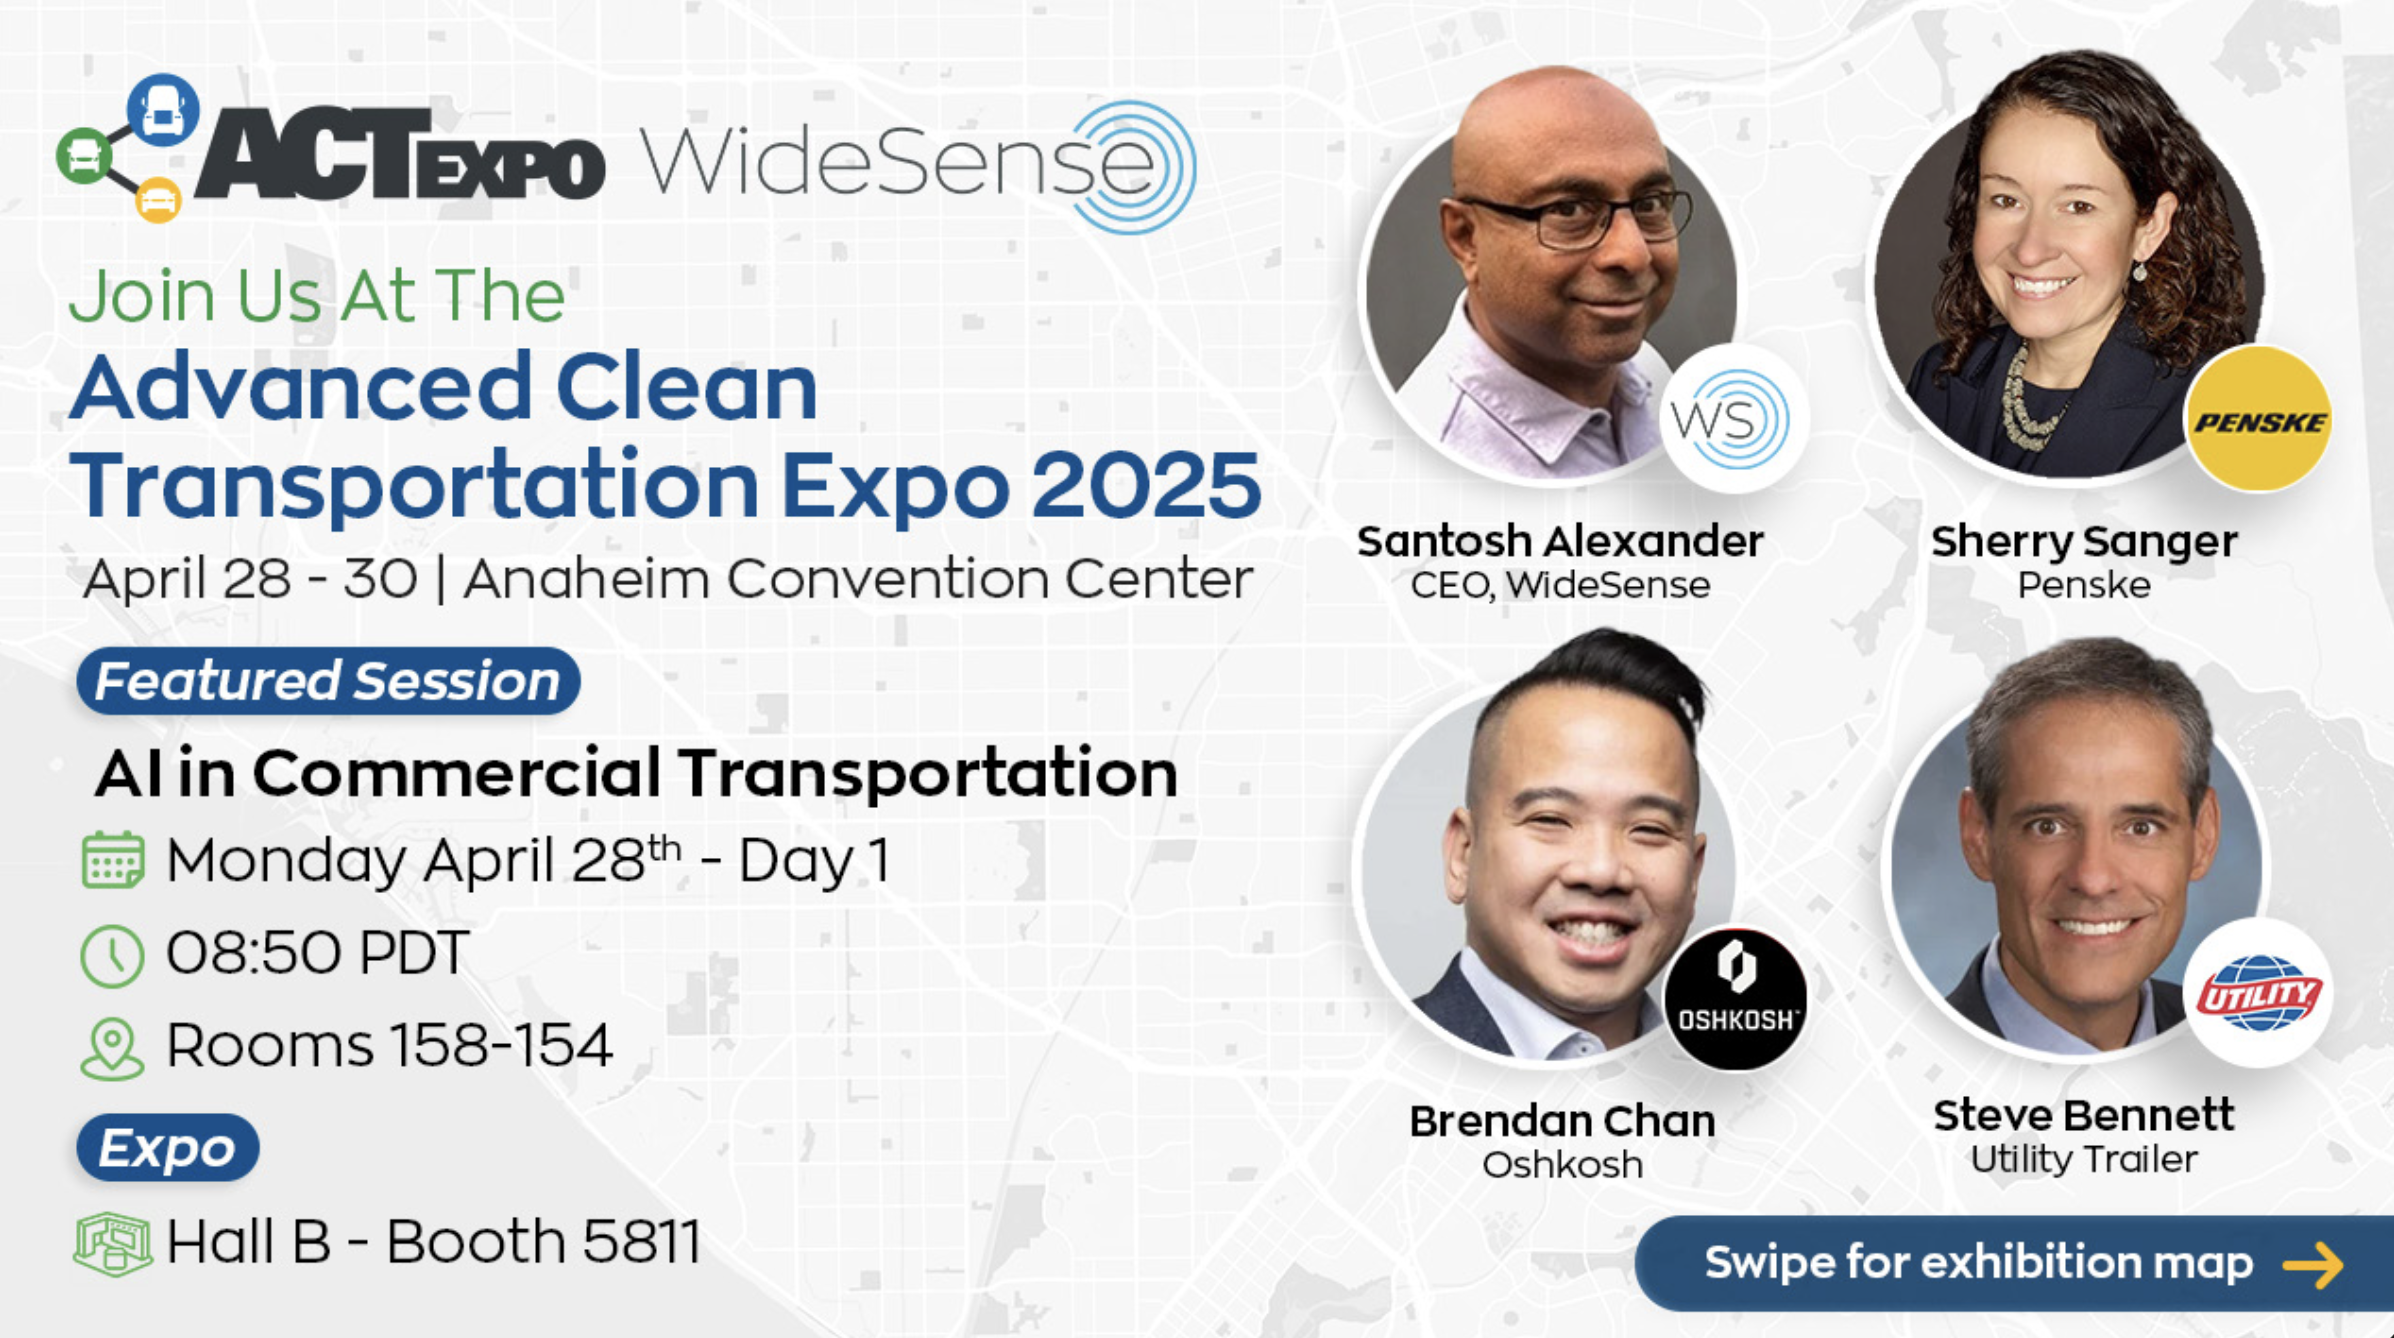
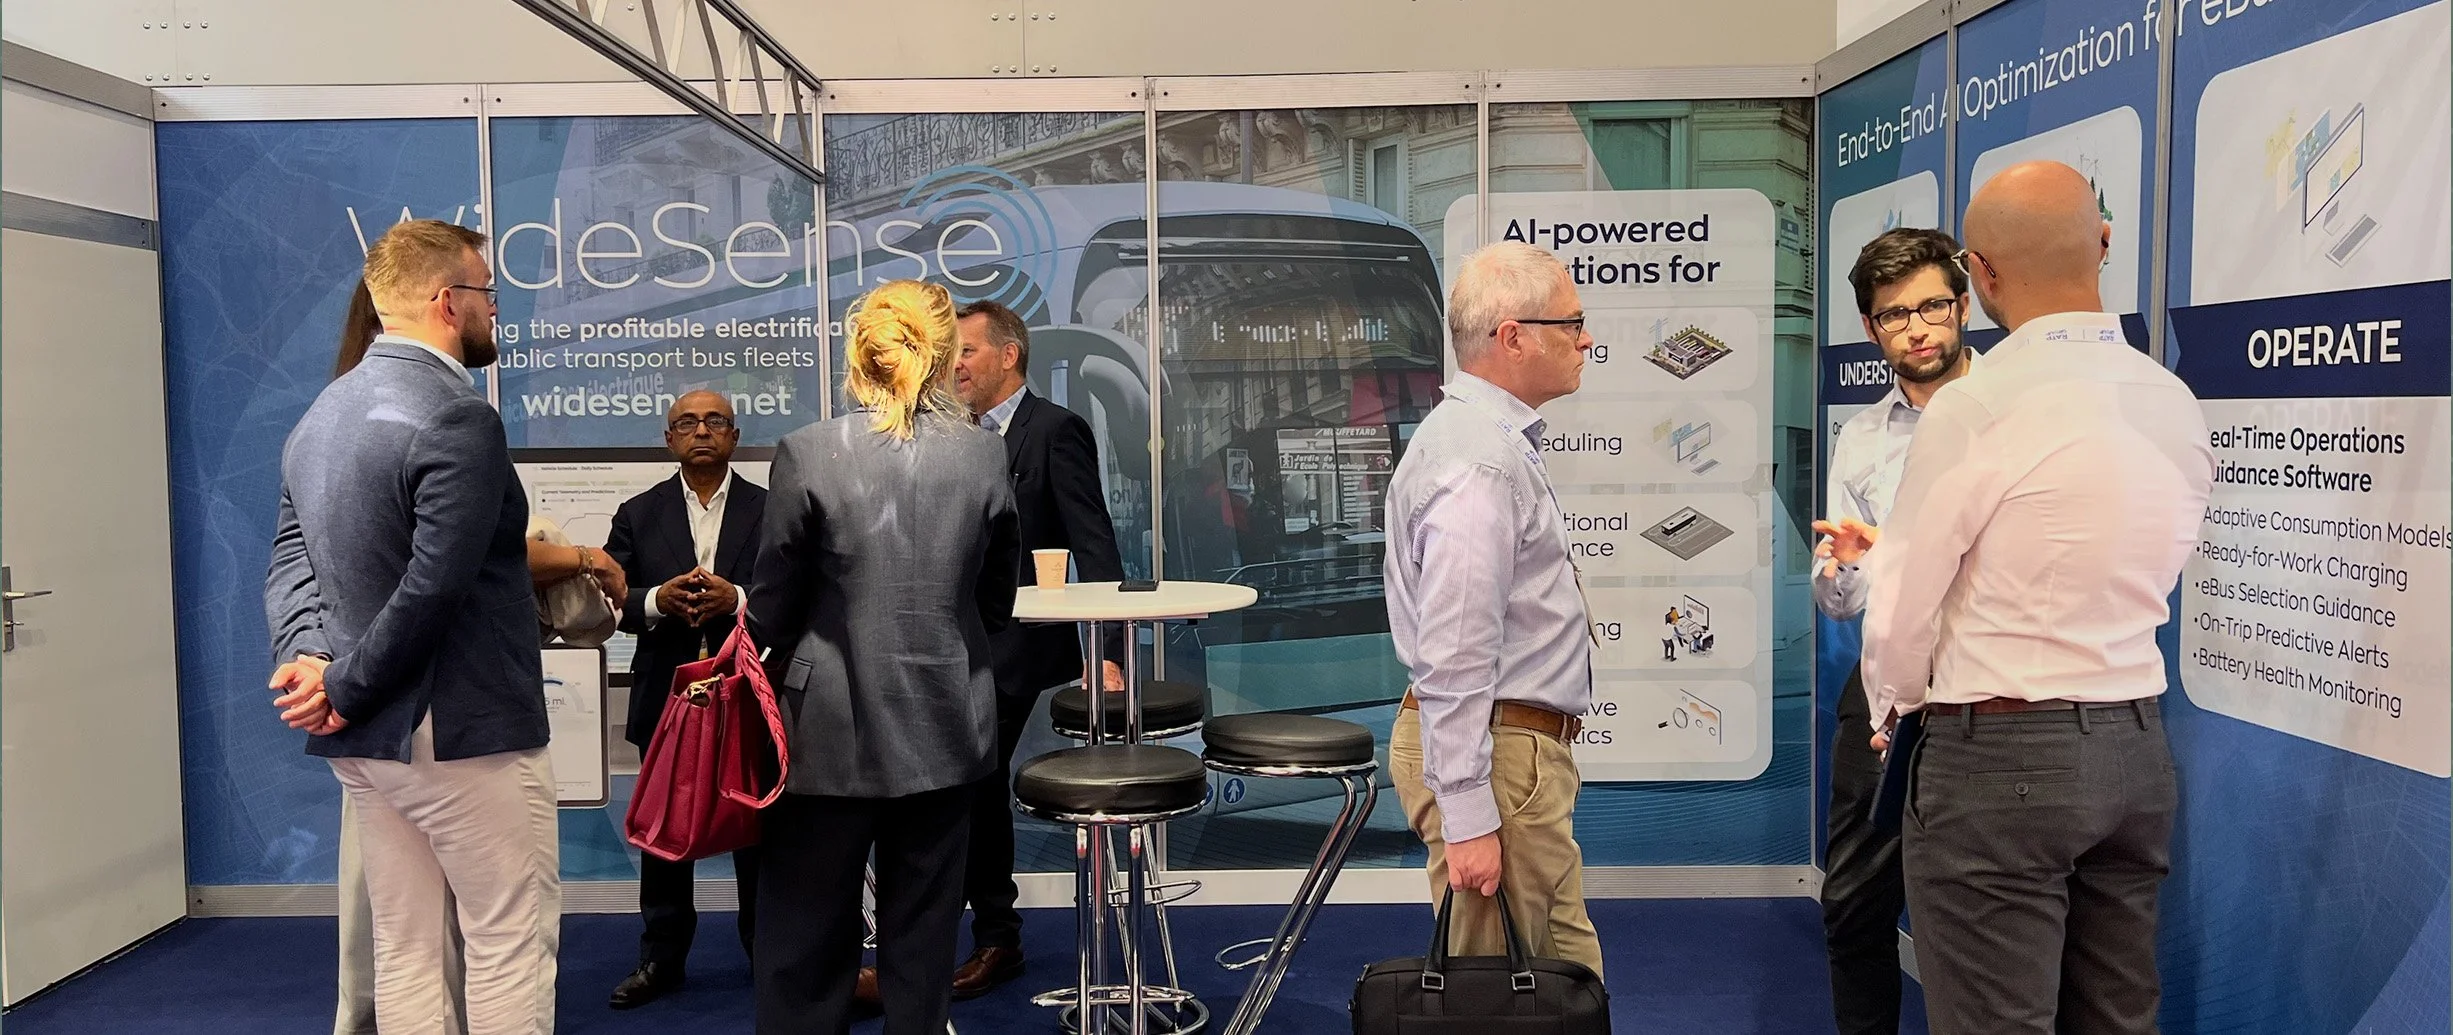
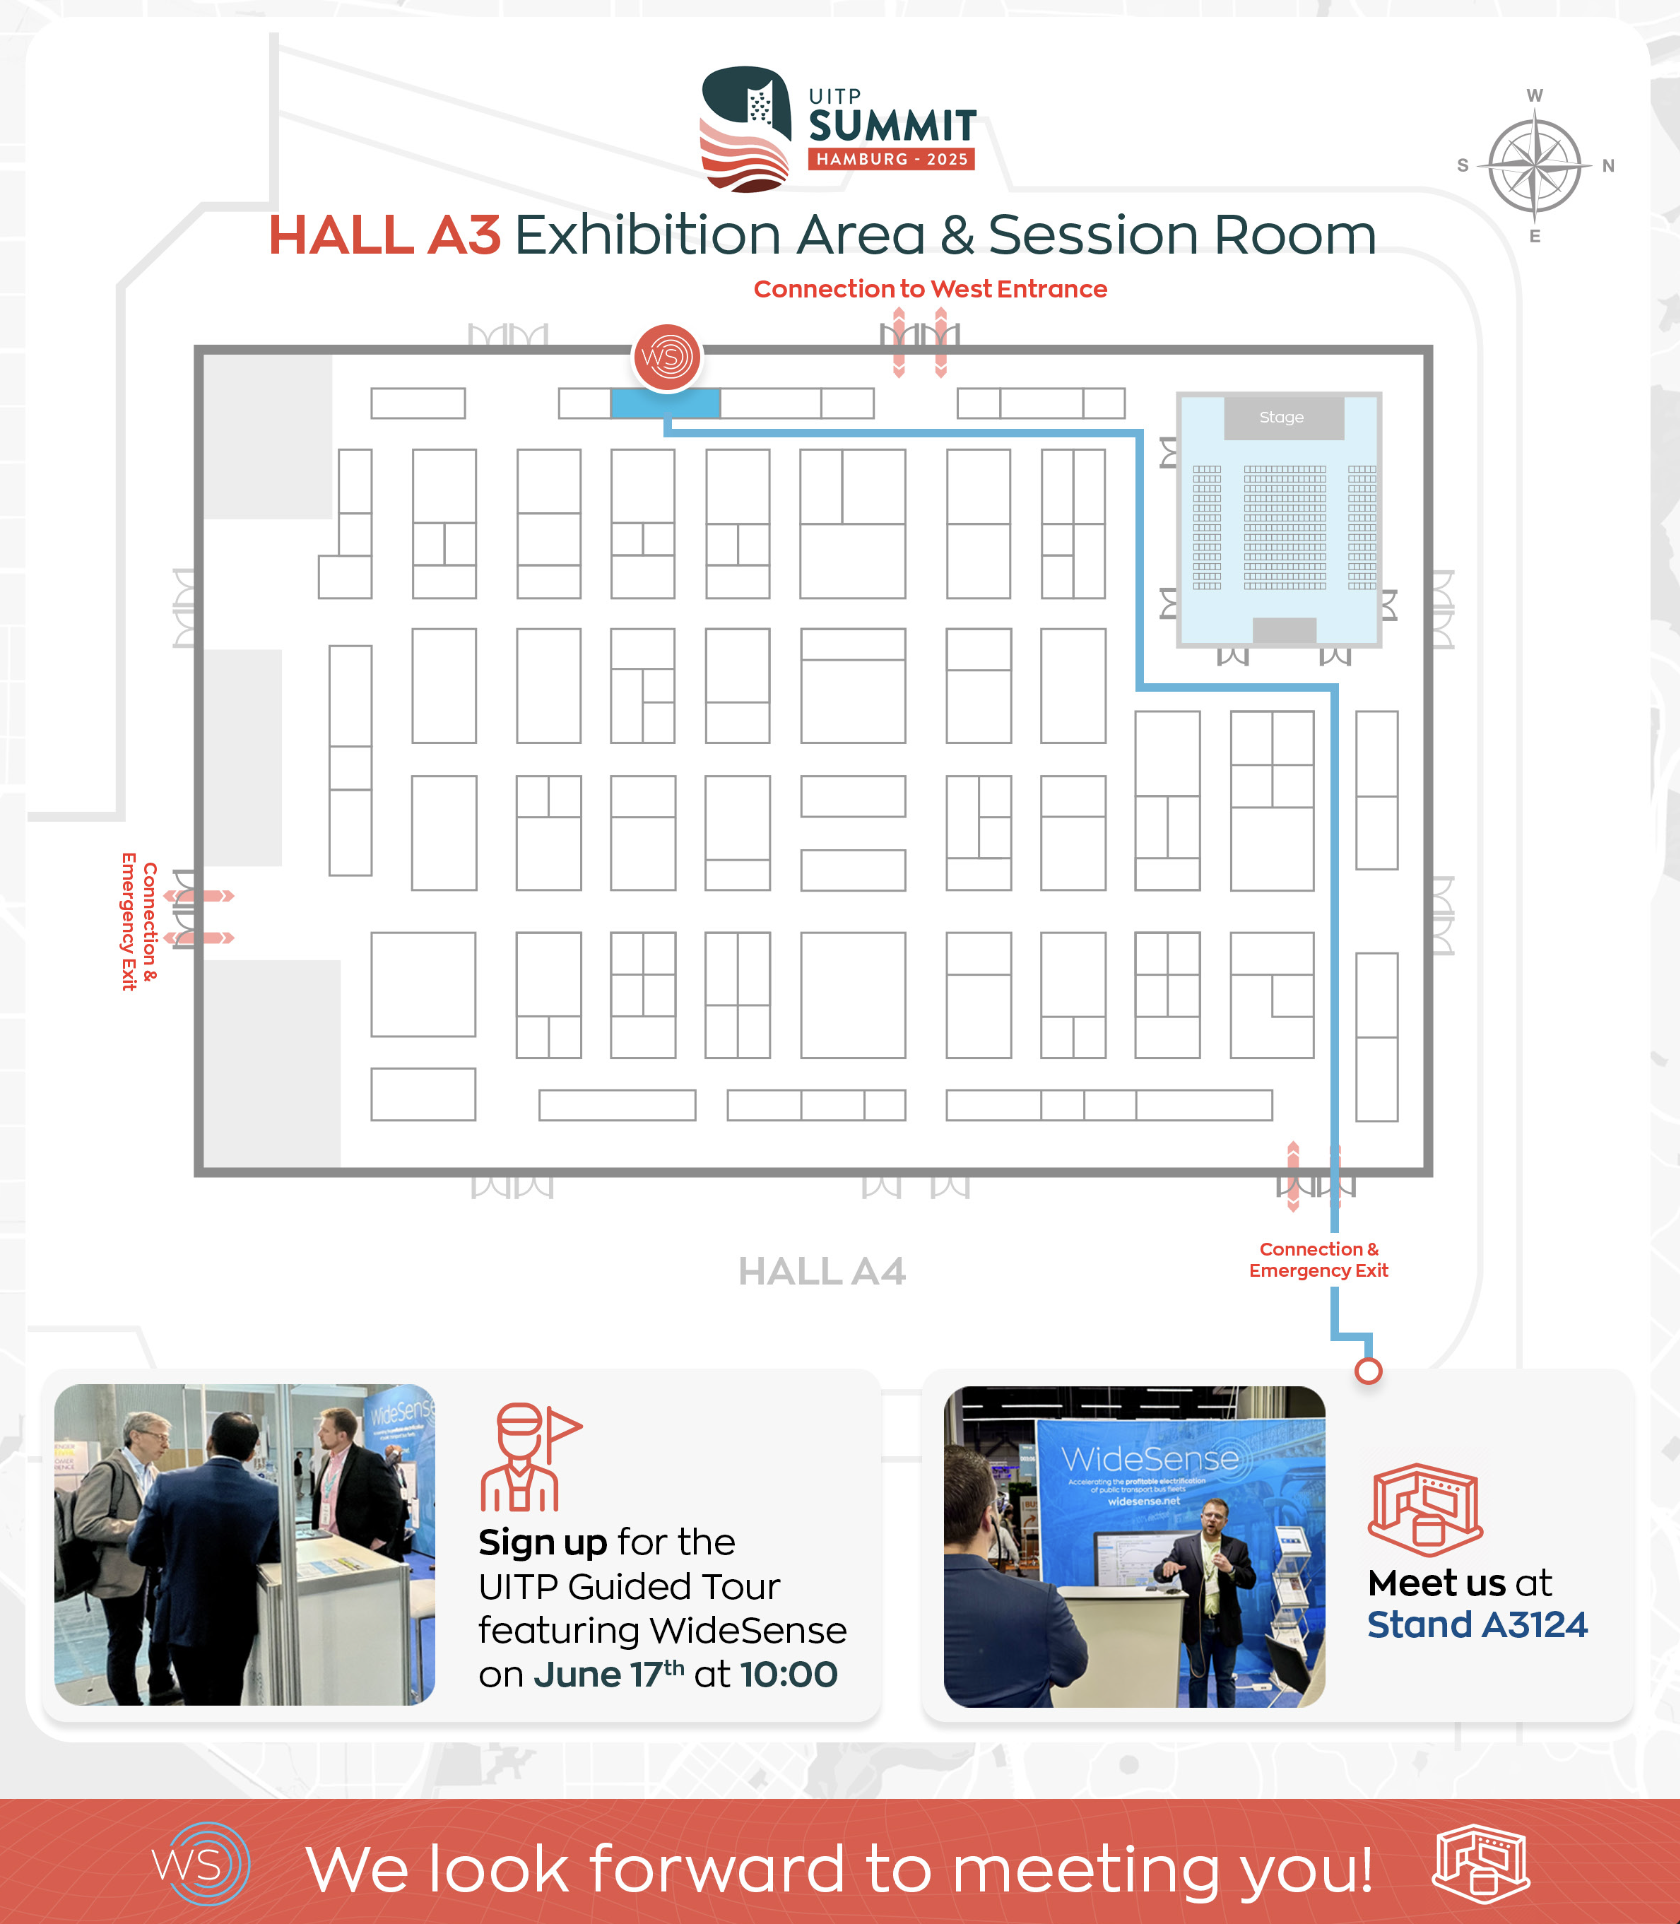
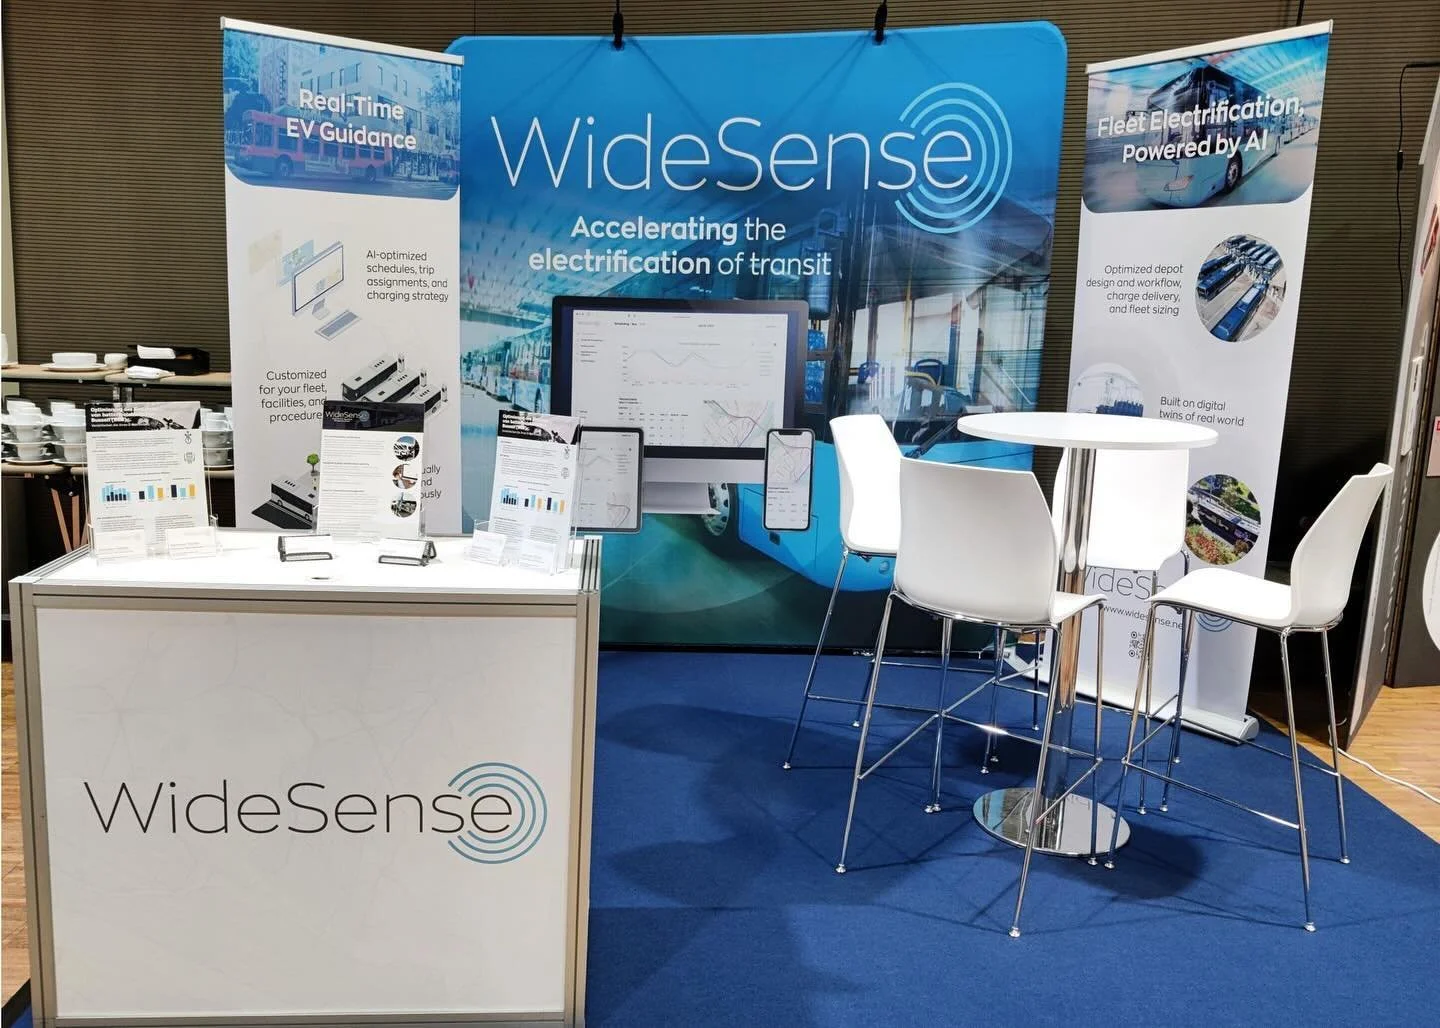
Supporting product launches and trade show presence at
How I help mobility companies
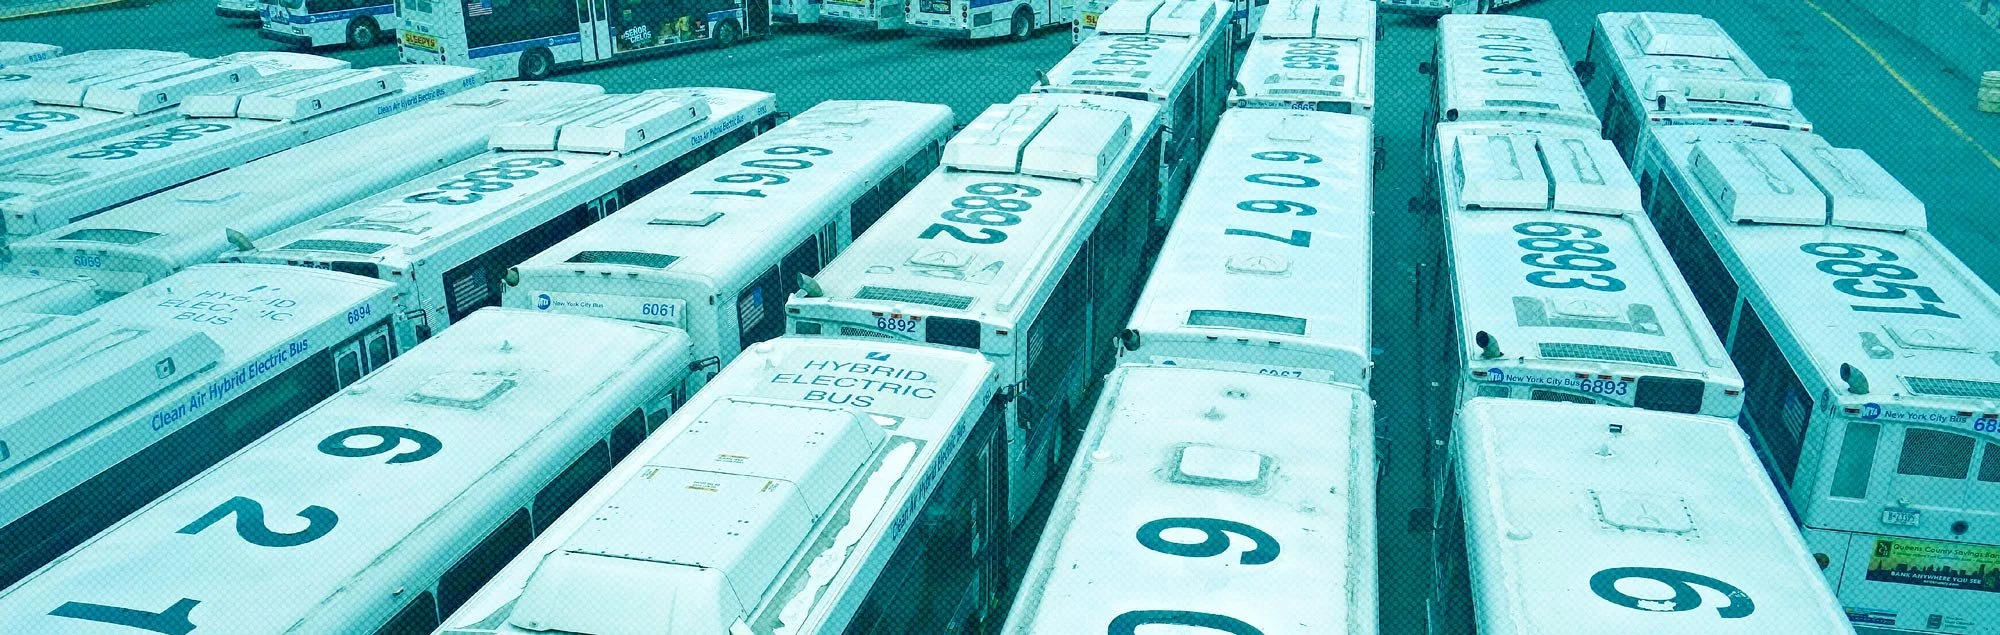
Depot and yard configuration

Lorem ipsum dolor sit amet, consectetur adipiscing elit, sed do eiusmod tempor incididunt ut labore et dolore magna aliqua.
Fleet
composition

Lorem ipsum dolor sit amet, consectetur adipiscing elit, sed do eiusmod tempor incididunt ut labore et dolore magna aliqua.
Charge and
fueling strategy
Lorem ipsum dolor sit amet, consectetur adipiscing elit, sed do eiusmod tempor incididunt ut labore et dolore magna aliqua.
how Transition Planning runs
A 3 step outline

Model how you
operate today
Build a bottom up digital twin from routes, timetables, reliefs, dwell times, yard layouts, tariffs, and work rules.
Explore
scenarios
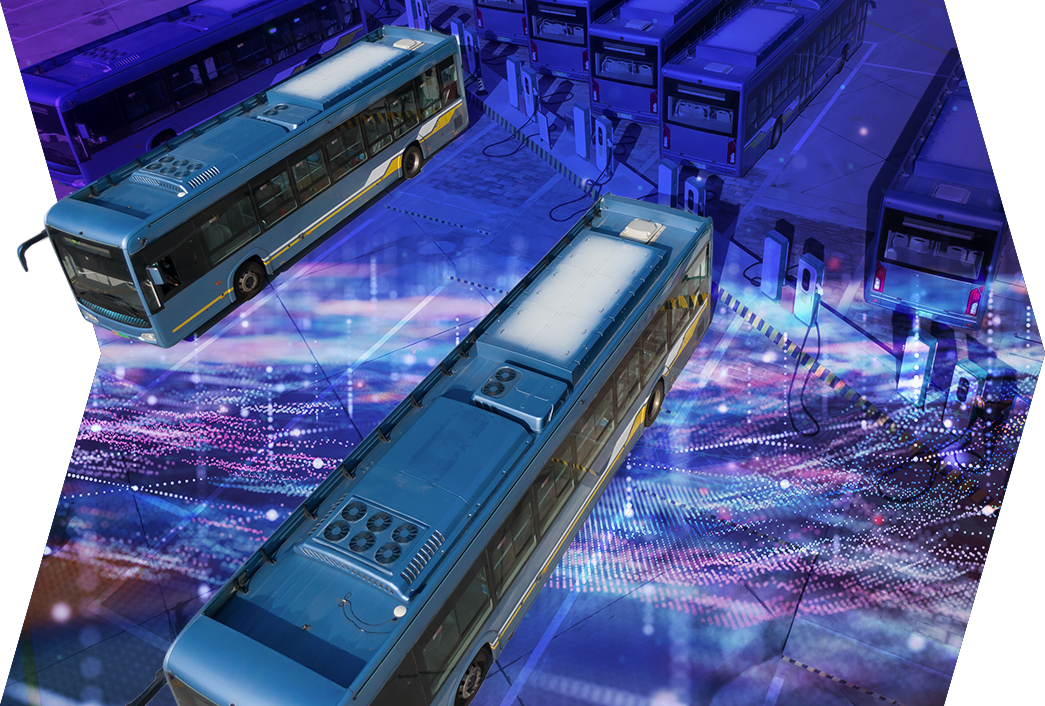
Use interconnected models to test fleet mixes, depot layouts, and energy strategies under realistic conditions.

Deliver
a blueprint
Provide a clear design
package with recommended fleet and depot configuration, charge or fuel strategy, and implementation phases.
how it links to
Spotlight and 360
Use Spotlight to understand current concessions, Transition Planning to design future ones, and 360
to keep them on track once live.
360
360 keeps everything connected day to day so each concession stays on track and your next bids are informed by real performance.

Spotlight
Spotlight gives you the first diagnostic and set of actions.
ready to get started?
Talk with us about an upcoming tender or transition and we will show how Transition Planning can de-risk it.